
Friday, April 9, 2010

Thursday, April 8, 2010


Chris Martenson - must read!!
YIKES!!!! This is a must read. To whet your appetite, here is a excerpt:
Taken together, this means that in only two short years, 2009 and 2010, as much new Treasury debt will be auctioned off to the public as was outstanding in 1995. Since government borrowing never gets paid down, at least in modern history, it means that the last two years have seen as much borrowing as happened over the period in which electricity was strung to every house, the highways were built, and our population tripled. What can we point to that was created over the last two years to rival those accomplishments.
Link: Must read Chris Martensen piece.


Wednesday, April 7, 2010
Gold in Euros, not Pesos.....Euros


Consumer credit decreased at an annual rate of 5-1/2 percent in February 2010. Revolving credit decreased at an annual rate of
13 percent, and nonrevolving credit decreased at an annual rate of 1-1/2 percent.
13 percent, and nonrevolving credit decreased at an annual rate of 1-1/2 percent.

Shopping Ctr Vacancies still Rising.
![[LEASE]](http://sg.wsj.net/public/resources/images/MI-BC561_LEASE_NS_20100406184428.gif)
Mortgage Rates Rising:
The Mortgage Bankers' purchase index, up 0.2 percent in the Easter week, added slightly to prior gains. But mortgage rates are the report's big headline, jumping 27 basis points in the week for 30-year loans to 5.31 percent in what the report blames on the end to Fed purchases of mortgage-backed securities. The jump in rates dried up demand for refinancing with the index down 16.9 percent. - Bloomberg
-Bank Credit: $8,853 bn.Bank credit has contracted $145 bn since Dec. 2009, vs. a contraction of $280 bn for all of 2009.
-U6 (Jobless + Marginally attached workers): 16.9% Upticks from 16.5%
-Dollar Index: 98.42, down vs. 99.5 on gains in oil and gold last week...Index rebased to 100 on 1.1.10.
-Weightings: US Broad Dollar Index: 60%/Gold 20%/Oil 20%
-DXY index: 103.67 vs. last week's 104.78. (for reference) rebased to 100 on 1.1.10.
-BIC est. 2010 gdp growth: 8.9%, raised from 8.75% due to China forecast
raised by 0.5% by the World Bank.
Weightings: China 60%/India 20%/Brazil 20%.
-China Rates: Tightening bias through loan restrictions: (=/-)
Tuesday, April 6, 2010
Data highlighted in RED updated this week.
Note: The Bank Credit data is continually revised, so we are only
publishing the change YTD from now on.
Links:
JOBS JOBS JOBS JOBS.....!!
U6 Ticks up to 16.9%

 Click on graph for larger image.
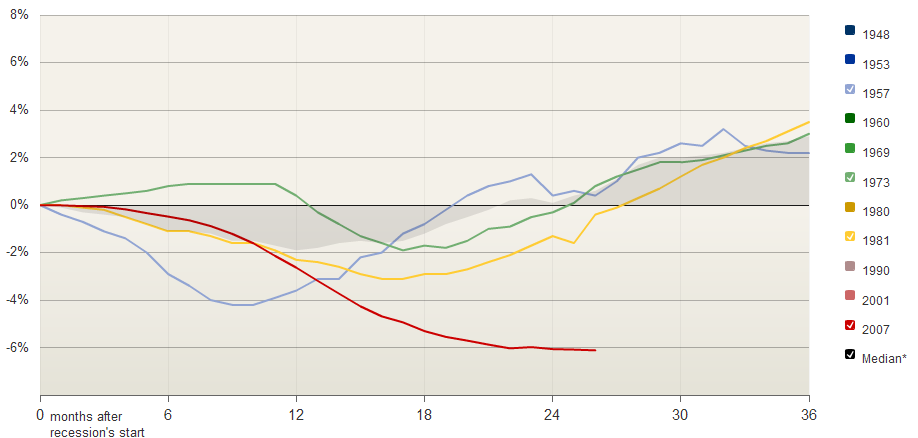
This graph shows the job losses from the start of the employment recession, in percentage terms - but this time aligned at the bottom of the recession. This assumes that the 2007 recession has reached bottom.
The current recession has been bouncing along the bottom for a few months - so the choice of bottom is a little arbitrary (plus or minus a month or two).
The current recession has been bouncing along the bottom for a few months - so the choice of bottom is a little arbitrary (plus or minus a month or two).

This graph shows the employment-population ratio; this is the ratio of employed Americans to the adult population.
The Employment-Population ratio ticked up slightly to 58.6% in March, after plunging since the start of the recession. This is about the same level as in 1983.
 Click on graph for larger image . Separations declining, but hiring not picking up, yet....Seekers per opening ticks up to 5.5 in Feb.
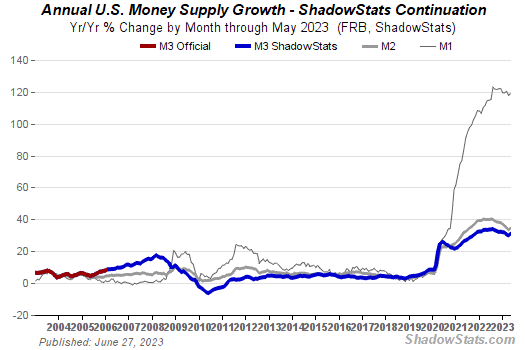
M3 Dropping at a rate of 4%, vs. 3.5% last reading...
National ISM Mfg. at 59.6 vs. 56.3 expected
Domestic Motor Vehicle Sales at 8.8mm rate vs. Feb's 7.7mm rate
Reis estimates CRE vacancies peaking:
 Click on graph for larger image in new window.
This graph shows the office vacancy rate starting 1991.
Reis is reporting the vacancy rate rose to 17.2% in Q1 2010, up from 17.0% in Q4, and up from 15.2% in Q1 2009. The peak following the previous recession was 16.9%.
Debt Productivity Plunges
.jpg)
Bank Credit: $8,853 bn.Bank credit has contracted $145 bn since Dec. 2009, vs. a contraction of $280 bn for all of 2009.
U6: 16.8% Upticks from 16.5%
Dollar Index: 98.42, down vs. 99.5 on gains in oil and gold last week...Index rebased to 100 on 1.1.10.
Weightings: US Broad Dollar Index: 60%/Gold 20%/Oil 20%
DXY index: 103.67 vs. last week's 104.78. (for reference) rebased to 100 on 1.1.10.
BIC est. 2010 gdp growth: 8.9%, raised from 8.75% due to China forecast
raised by 0.5% by the World Bank.
Weightings: China 60%/India 20%/Brazil 20%.
China Rates: Tightening bias through loan restrictions: (=/-)
Tipping Points:
| STATISTICS FROM THE US GOVT. |
| (Billions) |
| US GDP 2010: $14,620 |
| US Gross Debt: $12,464 |
| US Official (net) Debt 2010 $9,300, as % of GDP: 64% |
| Gross Federal Debt: $12,450: as a % of GDP: 85% |
| State &Local debt: $2,200, (approx) |
| US Deficit 2010: $1,556, as % of spending: 42% |
| US interest expense: $310, as a % of Federal Revenues: 17% US interest expense including FUNDED Social Security and Medicare is $310, or 17% of Federal Revenues. We should use this figure, because this is money that is has been spent already, but is still owed for entitlements. |
- Federal Interest Costs/Federal Revenues: 17% .The Tipping Point is 30%.
- USA Gov deficit as % of expenditures: 42%. The Bernholz definition of the tipping point is 40%.
- USA Gov Debt (net)/GDP: 64% (Gross debt is 85% which includes SS & M-care non funded obligations). Tipping Point is 90-100% as defined by Rogoff & Reinhart. There is an additional $440bn of GSE debt in default that could also be added. The current gross debt ceiling, which will be breached in 12 months, is $14.3Tn.
- Protectionism Meter: 5.5 on a scale of 10. Rising trend. Premier Wen's speech.
- Federal Reserve QE post March 2010 status: TBD
Official Debt is borrowings held by the public.
Gross d
Subscribe to:
Posts (Atom)