Friday, April 30, 2010

Comments on the GDP Report


A few comments on Q1 GDP Report

By Spector
The change in private inventories was smaller this quarter - adding 1.7% to GDP in Q1 2010 compared to 4.4% in Q4 2009. It is important to note that the inventory contribution to Q4 GDP was from a slowdown in the liquidation of inventories, but in Q1 businesses were building inventories - and this inventory build will probably slow in Q2.

As I noted earlier, the two leading sectors, residential investment (RI) and personal consumption expenditures (PCE), were mixed. RI declined to a new record low as percent of GDP, however PCE increased at a 3.6% real annualized rate.

The increase in PCE does not seem sustainable unless employment and incomes increase soon. A large portion of the increase in PCE came from a decrease in personal saving.

Personal Saving as Percent of DPIClick on graph for larger image in new window.

This graph shows personal saving as a percent of disposable personal income.

It is not unusual for the saving rate to decline at the beginning of a recovery as people become more confident. This helps drive consumer spending, but with the high levels of household debt, I expect the saving rate to increase over the rest of the year.

Here are some Q1 numbers (all annualized):
  •  Personal consumption expenditures (PCE) increased $130.7 billion

  •  Personal saving declined $88.5 billion.

  •  Government social benefits to persons increased $61.1 billion.

    So the boost in PCE came from the decline in saving and the increase in benefits. That is not sustainable.

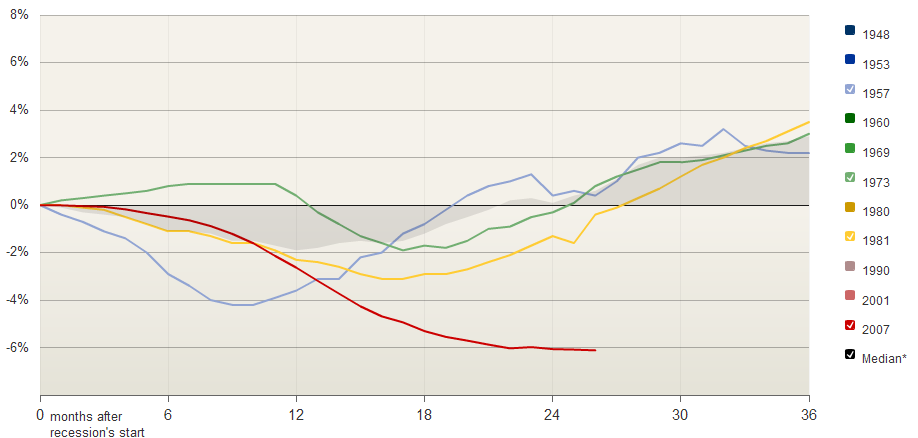
    Real Personal Income less transfer paymentsThe second graph shows real personal income less transfer payments as a percent of the previous peak.

    Unlike the recovery in GDP (previous post), real personal income less transfer payments has barely increased and is still 6.6% below the pre-recession level.

    The peak of the stimulus spending is in Q2 2010 (right now), and then the stimulus spending starts to taper off in the 2nd half of 2010. So underlying demand better increase soon - and that means jobs and incomes going forward.

    Unfortunately residential investment is usually one of the key engines for employment and growth at the beginning of a recovery - and I expect RI to be sluggish all year because of the huge overhang of existing housing units. So my guess is the recovery will probably remain sluggish, and I still expect a slowdown in the 2nd half of 2010.

  • Tuesday, April 27, 2010

    DOE chart

    ECB MAY HAVE TO GO NUCLEAR


    Home Prices vs. Jobs

    House Prices and Unemployment RateClick on image for larger graph 

    Case Shiller analysis by Zerohedge


    Unadjusted Case-Shiller data for February indicated that on a sequential basis the decline in home prices is accelerating. And this is even with every stimulus imaginable thrown at the problem. We can't wait to see what happens with the latest round of homebuyer subsidies runs out. As the press release states:
    “Existing and new home sales, inventories and housing starts all show tremendous improvement in their March statistics. The homebuyer tax credit, available until the end of April, is the likely cause for these encouraging numbers and this may also flow through to some of our home price data in the next few months. Amidst all the news, however, we should also pay heed to foreclosure activity, which have reached their highest level in at least the last five years. As these homes are put up for sales, we may see some further dampening in home prices. ”

    Monday, April 26, 2010

    More on Housing

    Prices +0.3% y/y, down 2% m/m...lots of seasonal noise. (Feb.)

    Loan Performance House Price Index


    But, Rental Vacancies remain elevated, indicating that there are still an excess of 1.7mm units in housing out there...

    Rental Vacancy Rate

    New Home Inventories Plummet


    New Home Months of Supply and RecessionsMonths of supply declined to 6.7 in March from 8.6 in February. This is significantly below the all time record of 12.4 months of supply set in January 2009, but still higher than normal.

    New home sales are counted when the contract is signed, so this pickup in activity is probably related to the tax credit. Note that that a few thousand extra sales NSA in March

    It's Baaaaack! (Inflation)


    From the Leggett & Platt earnings call:
    Karl Glassman - Leggett & Platt, Incorporated - EVP, COO
    “…If there is a difference today, it is the magnitude and the variety of inflation. From our finished bedding and furniture customers' standpoint not only are they getting it from steel but they are seeing it -- everything petrochemical-based.

    “So they are getting foam increases, fiber increases. The leather guys are seeing huge inflation in hides. Cardboard. All the MDFs [medium-density fiberboards]. So it is a challenge.

    “Historically the retailers have said to the manufacturing customers, we won't let you pass through. Our manufacturer customers are in a squeeze. They have to pass it through at retail. The magnitude and the velocity of this, retail has to move this time.”

    Monday, April 19, 2010

    Taxes Witheld by Govt Abysmal


    Below is an update of the most recent US Treasury tax withholding picture. As one can very plainly see it is getting worse, on both a week over week, a YTD cumulative basis, and, probably most relevantly to some readers, on a 4 week running bucket cumulative basis. In the week ended April 16, the US Treasury collected $29.3 billion, 10% less than the comparable week in the prior year when $32.5 billion was withheld. Cumulatively, the difference is now at an almost 2010 high, hitting a $16.7 billion difference between the YTD period and the comparable period in 2009 (only highest cum total was in Week 2).

    Saturday, April 17, 2010

    Is there something coming up in November?

    Christina Romer says economy "very far from normal"

    Friday, April 16, 2010

    Jean-Marie Eveillard lunch notes


    EVEILLARD
    Keys to successful value investing...
    - The future is uncertain, so humility and caution are important mindsets
    - As Graham said, identify a company's intrinsic value, say $50, buy at $35 and begin selling at $45.
    - Buffett diverged from Graham by identifying his "moat" as the likelihood of a company's continuing operations rather than just valuation
    - Value knows no borders. Exploit idiosyncracies and inefficiencies in countries, sectors, neglected markets. (Peter Lynch said whoever turns over the most rocks wins.) He gave the example of many German stocks, whose earnings were understated due to excess reserves and Japanese stocks, whose underlying ex-cash ROEs are higher than unadjusted figures suggest.
    - Buffett and Munger succeeded by reading voraciously, so he does the same.
    - Efficient Market Hypothesis is bunk. Supporting evidence in the SuperInvestors of Graham & Doddsville Revisited, to which JME was added in 2004 http://papers.ssrn.com/sol3/papers.cfm?abstract_id=878145
    Psychology of value investing...
    In the short run the market is a voting machine, but in the long run a weighing machine. In the short run, value investors will lag and suffer. In the Internet bubble of 1997-2000, JME lost 70% of his investors. Value investors need the psychological capital to withstand social pressures from bosses, peers, etc. during this underperformance. But ultimately value, like truth, will out. Key to withstanding this pressure is alignment of your time horizon and investors, i.e. pick your clients. Know the difference between temporary unrealized capital loss and permanent capital impairment.
    Current View
    - JME's outlook is for 3-4 years of "muddle thru" economic growth, not 3-4 years of severe economic declines. Probability of the latter, however, is non-zero.
    - JME is amazed that the common view is that no one saw the crisis coming. Austrian School adherents, including him, did see it. The BIS whitepaper in 2006 explaining how busts follow credit booms was the best red flag. http://www.bis.org/publ/work205.pdf
    - Hegemony of Keynesians and Monetarists over the last 80 years have forced "solutions or answers" in the form of deficit spending or lower rates. The Austrian School offers no recipes or solutions. Rather, Austrians say credit busts follow booms and admonishes authorities not to kick the can down the road.
    - JME sees 3 potential outcomes, the last being most likely...
    1. The economy will see a 3-5 year expansion driven by liquidity and leverage, meaning we remain in the post-WW2 landscape . Current market rally supports this thesis.
    2. Deleveraging -- due to lack of lending and borrowing -- will leave the Fed pushing on a string, see Japan. Unlikely to happen as the West does not have Japan's spirit of resignation, so authorities will stimulate further leading to #3.
    3. Most worrisome (and most likely) scenario is that 0% rates, an unprecedented budget deficit and the ballooning Fed balance sheet will lead to unintended consequences, i.e. high inflation. To invest in this environment, own gold and equities (real assets with pricing power).
    Asides / One-Liners
    - Japan is awash in stocks with net cash that exceed their market cap -- sadly, he didn't name names...
    - In his next life, JME wants to come back as a closed end fund.
    - "The US today feels like 1788 in France."
    - 100% annual turnover does not equate to investing.
    - Share repurchases should only be completed if mgmt can sell the entire business for much more than the market says it is worth.
    Gold
    At above $1000/oz, it is difficult to value gold. Rather, it should be seen as an alternative currency. In a world where many sovereign credits are under suspicion, there are no appealing currencies today.
    The First Eagle Global Fund holds 10.9% of its AUM in gold and gold mining stocks. In Sept 2008, a Bloomberg interview revealed he held $1bn in gold in a vault in NY... http://www.bloomberg.com/apps/news?pid=20601101&sid=a8L00oInO1YM

    Banks are lending again?

    Andy Lees, UBS:
    The Fed balance sheet expanded 1.3% w/w to a new all time high. US commercial bank cash liquidity fell heavily to 9.85%from 11.1%. Actual cash levels plunged by USD126.3bn, but the reason was the money was clearly piled into assets which jumped in value by USD233.3bn. Overall bank assets are now at their highest since July 2009 and just 3.75% off their all time high, presumably indicating sufficient confidence that the banks are willing to blow the cobwebs off their wallets once again. This may well explain why the Fed’s balance sheet is expanding again; it is not being driven by its own monetary expansion but rather by the commercial banks actually starting to take the lead again and expand credit. Other positive data showed credit card delinquency rates falling. More consumers have cash on hand from tax rebates and put the money towards holding down debt.

    Wednesday, April 14, 2010

    Home Prices in Orange County are bouncing...
    For March
    SlicePriceYr. agoSalesYr. ago
    Houses$515,000+19.4%1,668+4.2%
    Condos$300,000+19.0%855+18.3%
    New$471.500-1.8%129+18.3%
    All O.C.$432,000+12.2%2,652+9.0%
    Orange County Office Vacancies, Should we relocate?
    Mortgage Apps drop 9.6% on Higher FHA premiums.

    MBA Purchase Index
    Retail Sales up 1.6% m/m

    Retail Sales

    Tuesday, April 13, 2010

    Charts for WIF letter


    Recession Measure IncomeReal incomes less transfer payments as a percent of the previous peak...we have a long way to go...


    Change in Nonfarm Payroll


    In

    Int paym

    Inter>

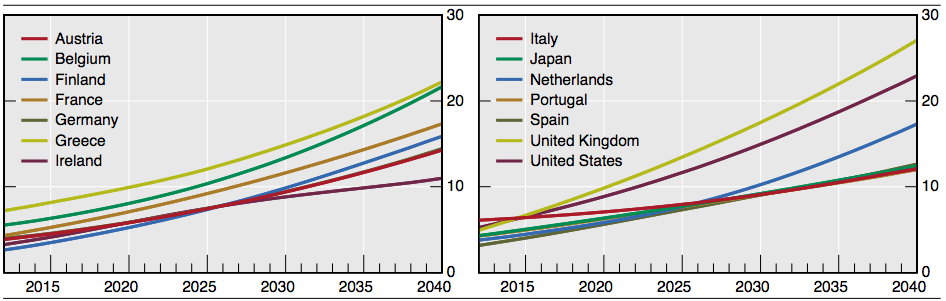
    Interest Payments as a % of GDP (projected)


    SMORGASBORD

    NFIB INDEX WEAK:

    The NFIB Small Business Optimism index came in at 86.8, a decline from the March's read. As the NFIB itself confirms: "The persistence of index readings below 90 is unprecedented in survey history. “The March reading is very low and headed in the wrong direction,” said Bill Dunkelberg, NFIB chief economist. “Something isn’t sitting well with small business owners. Poor sales and uncertainty continue to overwhelm any other good news about the economy.”

    Is a second wave of defaults on the way?

    Bad Bank Loans Soar


    Trade deficit a touch higher vs. estimates.
    U.S. Trade Deficit

    Monday, April 12, 2010

    No Wonder Things Feel Lousy


    Recession Measure IncomeReal incomes less transfer payments as a percent of the previous peak...we have a long way to go...

    Sunday, April 11, 2010

    Is this the biggest story of the year???

    Link: Whistleblower tells all regarding JPMorgan Gold Price Manipulation
    Excerpt:
    There is no silver lining to the activities of JPMorgan Chase and HSBC in the precious-metals market here and in London, says a 40-year veteran of the metal pits.

    The banks, which do the Federal Reserve's bidding in the metals markets, have long been the government's lead actors in keeping down the prices of gold and silver, according to a former Goldman Sachs trader working at the London Bullion Market Association.

    Maguire was scheduled to testify last week before the Commodities Futures Trade Commission, which is looking into the activities of large banks in the metals market, but was knocked off the list at the last moment. So, he went public.

    Maguire -- in an exclusive interview with The Post -- explained JPMorgan's role in the metals pits in both London and here, and how they can generate a profit either way the market moves.

    Saturday, April 10, 2010

    Making Sure We Don't Lose Sight of the Big Picture!

    Doug Noland, Federated Funds:

    Despite alarming financial vulnerability, state and local governments continue to pile on debt at incredibly attractive terms. In spite of underlying financial and economic fragility, junk debt issuance is running at record pace. Inflows continue to inundate bond funds - at home and abroad. Estimates now put hedge fund asset as high as $2 Trillion by the end of the year. Retail stocks are not far away from record highs. Risk premiums are narrow throughout.

    The massive issuance of government “money” has always been inflationism’s trump card. It’s now in play, and this latest round of inflationism is again profoundly distorting market perceptions. “Too big to fail” has broadened from large financial institutions to encompass the entire system. Today, GSE obligations and municipal debt enjoy “moneyness” only because of the markets’ belief that Washington will not tolerate disruptions in these key markets. Risk premiums throughout the corporate debt market have collapsed on the back of the view that massive stimulus ensures economic growth and strong company balance sheets. Throughout the risk markets, prices are bouyed by confidence that the Fed will restart monetization operations in the event of any market liquidity disruption. Hedge funds and other speculators are thriving once again as they successfully exploite Washington’s inflationary policymaking. Washington is there with ongoing massive fiscal stimulus, ultra-low interest rates, and a liquidity backstop.

    I noted above that “‘Money’ is inherently dangerous because virtually insatiable demand creates a propensity for over-issuance.” There is a second fundamental danger inherent in “money:” A loss of confidence immediately incites a very disruptive systemic dislocation. If you can’t trust money, what can you trust? No trust – no functioning Credit system or stable economy. Indeed, you really don’t want to mess with “money.”

    Importantly, you don’t want to allow distortions in money perceptions to establish a foothold. Such distortions are always and everywhere the lifeblood of Bubbles. Above all, you certainly don’t want to finance a massive inflation of non-productive debt with “money.” This only ensures a problematic widening gulf between perceptions of safety and liquidity and the actual deteriorating underlying soundness of these financial claims. And when the inflation of this money is also distorting market perceptions for Credit and asset prices throughout the entire system, inflationism is really playing with fire. Money Not Good.


    Friday, April 9, 2010

    From Bank of Intl Settlements:

    Distressed sales as a % of home sales rising...
    Distressed Sales

    Thursday, April 8, 2010

    Perspectives on the Recession


    Change in Nonfarm Payroll


    >

    Change in GDP

    Change in Industrial Output


    >

    Chris Martenson - must read!!

    YIKES!!!! This is a must read. To whet your appetite, here is a excerpt:
    Taken together, this means that in only two short years, 2009 and 2010, as much new Treasury debt will be auctioned off to the public as was outstanding in 1995. Since government borrowing never gets paid down, at least in modern history, it means that the last two years have seen as much borrowing as happened over the period in which electricity was strung to every house, the highways were built, and our population tripled. What can we point to that was created over the last two years to rival those accomplishments.


    Overall, the U.S. industry’s hotel occupancy ended the week with a 3.6-percent decrease to 54.1 percent, ADR dropped 4.4 percent to US$94.45, and RevPAR was down 7.9 percent to US$51.05. The first decline in six weeks. But recall that 2009 was the worst year since the 1930s.

    Hotel Occupancy Rate

    Links:
    Projected Interest Payments as a % of GDP:


    Jobless Claims came in 10k above the high estimate.
    No wonder Ben said what he said yesterday.

    Weekly Unemployment Claims

    Wednesday, April 7, 2010


    Gold in Euros, not Pesos.....Euros


    Consumer credit decreased at an annual rate of 5-1/2 percent in February 2010. Revolving credit decreased at an annual rate of
    13 percent, and nonrevolving credit decreased at an annual rate of 1-1/2 percent.
    Consumer Credit


    Shopping Ctr Vacancies still Rising.
    [LEASE]

    Mortgage Rates Rising:
    The Mortgage Bankers' purchase index, up 0.2 percent in the Easter week, added slightly to prior gains. But mortgage rates are the report's big headline, jumping 27 basis points in the week for 30-year loans to 5.31 percent in what the report blames on the end to Fed purchases of mortgage-backed securities. The jump in rates dried up demand for refinancing with the index down 16.9 percent. - Bloomberg


    -Bank Credit: $8,853 bn.Bank credit has contracted $145 bn since Dec. 2009, vs. a contraction of $280 bn for all of 2009.
    -Rates: 10yr: 3.94%(++) Fed Funds: 0.25% (=) See Chart Here.
    -S&P eps estimate: $80 (+) P/E: 14.3x See Source Here.
    -U6 (Jobless + Marginally attached workers): 16.9% Upticks from 16.5%

    -Dollar Index: 98.42, down vs. 99.5 on gains in oil and gold last week...Index rebased to 100 on 1.1.10.

    -Weightings: US Broad Dollar Index: 60%/Gold 20%/Oil 20%
    -DXY index: 103.67 vs. last week's 104.78. (for reference) rebased to 100 on 1.1.10.
    -BIC est. 2010 gdp growth: 8.9%, raised from 8.75% due to China forecast
    raised by 0.5% by the World Bank.
    Weightings: China 60%/India 20%/Brazil 20%.
    -China Rates: Tightening bias through loan restrictions: (=/-)