Wednesday, October 27, 2010

This Chart Doesn't Compute! (vs. earlier recessions)

Typically BEFORE the end of every recession, new home sales rise sharply, and keep rising afterwards.
This time?  Not so much.

New Home Sales and RecessionsThis graph shows New Home Sales vs. recessions for the last 47 years. The dashed line is the current sales rate.
Sales of new single-family houses in September 2010 were at a seasonally adjusted annual rate of 307,000, according to estimates released jointly today by the U.S. Census Bureau and the Department of Housing and Urban Development. This is 6.6 percent (±16.9%)* above the revised August rate of 288,000, but is 21.5 percent (±13.3%) below the September 2009 estimate of 391,000.

Tuesday, October 26, 2010

Trucking

ATA: Truck Tonnage Index increases in September: "Economy barely growing"


From the American Trucking Association: ATA Truck Tonnage Index Rose 1.7 Percent in September
The American Trucking Associations’ advance seasonally adjusted (SA) For-Hire Truck Tonnage Index increased 1.7 percent in September after falling a revised 2.8 percent in August. The latest gain put the SA index at 108.7 (2000=100) in September from 106.9 in August.
...
Compared with September 2009, SA tonnage climbed 5.1 percent, which was well above August’s 2.9 percent year-over-year gain. Year-to-date, tonnage is up 6.1 percent compared with the same period in 2009.

ATA Chief Economist Bob Costello said that truck tonnage over the last few months fits with an economy that is growing very slowly. “While I am glad to report that tonnage grew in September, the fact remains thattruck freight volumes leveled off over the summer and early autumn. This is a reflection of an economy that is barely growing.”
ATA Truck Tonnage IndexClick on map for larger image.

This graph from the ATA shows the Truck Tonnage Index since Jan 2006.

The lines are added to show the index has mostly "leveled off".

Monday, October 25, 2010

Saturday, October 23, 2010

Best Quote

Kenneth Rogoff, a Harvard professor and former International Monetary Fund chief economist, puts it differently. He likens the Fed’s predicament to a golfer stuck in a sand bunker. Tap lightly and the ball will not get out of the hazard. “I would say: ‘I am now going to slam the ball and I don’t know where it is going to go but if it ends up on the fairway I am going to hit it towards the hole,” he says of the Fed’s next step.

Friday, October 22, 2010

Huge Drop in Home Prices?

Clear Capital™ Reports Sudden and Dramatic Drop in U.S. Home Prices

“Clear Capital’s latest data through October 22 shows even more pronounced price declines than our most recent HDI market report released two weeks ago,” said Dr. Alex Villacorta, senior statistician, Clear Capital. “At the national level, home prices are clearly experiencing a dramatic drop from the tax credit-induced highs, effectively wiping out all of the gains obtained during the flurry of activity just preceding the tax credit expiration.”

This special Clear Capital Home Data Index (HDI) alert shows that national home prices have declined 5.9% in just two months and are now at the same level as in mid April 2010, two weeks prior to the expiration of the recent federal homebuyer tax credit. This significant drop in prices, in advance of the typical winter housing market slowdowns, paints an ominous picture that will likely show up in other home data indices in the coming months.

... if previous correlations between the Clear Capital and S&P/Case-Shiller indices continue as expected, the next two months could be ugly.

BLS data State by State

In the latest amusing discrepancy to come out of the BLS, today's reported unemployment data by state indicated that at the end of September, there was a total of 129,699,600 people employed across the various states. Not very surprisingly, the biggest deterioration occurred in California which lost 63.5 K jobs, followed by New York at 37.6K (Wall Street layoffs?) and Massachusetts at 20.9K. The total change from August's 129,923,400 employed was a drop of 223,800. Well, this is a little confusing as the NFP number for September indicated that total jobs lost were 95,000, a slightly more than 50% improvement compared to the job losses at the state level. As Zero Hedge has demonstrated, the data coming out of the BLS is statistically impossible to say the least, and at best, worthless. But now at least we are getting confirmation that just like in the Fed, there may be those within the BLS, who actually know how to count. Too bad, those are not the people in charge of actual propaganda dissemination.

Thursday, October 21, 2010

Philly Fed Index

Philly Fed IndexClick on graph for larger image in new window.

This graph shows the Philly index for the last 40 years.

This index turned down sharply in June and July and was negative in August and September (indicating contraction). The index was barely positive in October, and the internals (new orders, employment) are still weak.

BLS data on Jobless Claims. Pure Comedy

"Beats" the 455k est. @ 452k.  But wait a second, last week, which missed big at 462k, was revised
13k HIGHER to 475k.  In fact, of the last 24 weeks, 23 of the subsequent revisions have been
HIGHER (on average by 2k, which ain't much, but the direction is interesting).

Weekly Unemployment Claims

Wednesday, October 20, 2010

Quote du Jour!

In a front-page commentary in the overseas edition of the People's Daily, Li Xiangyang described the United States as the conflict's "first maker of tomb figures," a Chinese idiom that means someone who creates a bad precedent.

"If the global financial crisis was about nationalizing private debt, then in the post-crisis period the urgent need of the United States is to internationalize its national debt," he said.

Americans are Angry...China will be the Target..see the last chart!

Today's very remarkable analysis from Albert Edwards presents a stunning spin on the China-US Nash Equilibrium, concluding that wholesale tariffs with China are now inevitable: "If another round of credit-fueled investment is about to be unleashed onto a global economy, already on the verge of deflation " it will simply not be tolerated. Watch the trade data closely. Watch the US unemployment rate closely. The US public is on the verge of revolt which is increasing likely to end in across-the-board tariffs." Why has the SocGen strategist come to this conclusion? Simple - he now believes that "China is becoming a malevolent influence (my words) on the global economy and strong action is necessary." As to who gets to buy US bonds should China start a boycott or outright dumping? Who else: "Why, Mr Bernanke is just waiting for his chance."
The core if Edwards' argument is that the US public is angry. And we agree: "Some 42 million Americans were in receipt of food stamps in July, up some 18% yoy (see chart below). Make no mistake, the government isn't throwing money at people willy-nilly - those in receipt of stamps are on the poverty line, currently defined as a 2 adult and 2 children household having a net income of $22,056 p.a." And what is the global regime like in the face of this ongoing social deterioration? In a word - ugly:
Chinese foreign exchange reserves are rising at a record pace in order to maintain the yuan/US dollar peg... meanwhile the US is now running a record deficit with China on the latest data (see chart below - we run the data through Datastream's seasonal adjustment and the story is the same)... and meanwhile Chinese Premier Wen is warning that a 20% yuan rise would bankrupt Chinese companies and sharply rising unemployment would cause a major social upheaval (i.e. exactly what is happening in the US).
Obviously the last thing on China's mind is the welfare of the US consumer (when, ironically, it should be: it is after all still an export driven economy).
As if the US public wasn't enraged enough - resembling an angry bull pawing the ground and frothing at the nostrils " then surely it is best not to wave a large red rag at them. This came in the double-whammy of August#s record US trade deficit with China, and record quarterly $194bn surge in China's foreign exchange reserves to an eye-watering $2.65tr in Q3 (see chart below) - just what the matador ordered!
And something interesting happened today: from having a neutral view on China's mercantilism, Edwards has now gone very bearish.
Having completed my international economics modules at university, I have tried to follow the debate as closely as possible and there is merit on both sides of this fractious argument. But the one big surprise that has caught me out since the credit bubble burst is that the US trade deficit has not fallen further (and vice versa for the Chinese surplus). I  am persuaded by recent articles by Martin Wolf in the Financial Times that China is becoming a malevolent influence (my words) on the global economy and strong action is necessary - link. But who will buy all those Treasuries I hear you ask? Why Mr Bernanke is just waiting for his chance.

Two further excellent FT columns by the highly regarded economist, Gavyn Davies (link)and my old friend Peter Tasker (link) point out that due to the currency link aMASSIVE monetary ease will be transmitted from the US to China. No wonder China hiked rates in a surprise move yesterday to counter this threat.
Edward's conclusion, not surprisingly, given the preceding, is that should China launch more of the same policies, the US will simply snap, and the result will be a collapse in two decades of globalization.
The savvy market commentator Frank Veneroso has been at the forefront in pointing out that China?s investment-led model is unprecedented in the history of industrialisation (see chart below). And therein lies the rub. If another round of credit-fueled investment is about to be unleashed onto a global economy, already on the verge of deflation ? it will simply not be tolerated. Watch the trade data closely. Watch the US unemployment rate closely. The US public is on the verge of revolt which is increasing likely to end in across-the-board tariffs.

Tuesday, October 19, 2010

CRE, not so much

CRE and Residential Price indexesClick on graph for larger image in new window.

CRE prices only go back to December 2000.

The Case-Shiller Composite 20 residential index is in blue (with Dec 2000 set to 1.0 to line up the indexes). 

Thursday, October 14, 2010

Animal Spirits not so Spirited

Confidence Among U.S. Chief Executive Officers Fell in October

By Alex Kowalski
Oct. 14 (Bloomberg) -- Confidence among chief executive officers in the U.S. sank in October to the lowest level since May 2009, when the world’s largest economy was still in a recession, according to a survey from the Business Council.
The Washington-based group’s sentiment gauge dropped to 51.2 this month from a two-year high of 66.6 in May, a report showed today. As calculated by the Conference Board, readings greater than 50 signal economic growth.
“The momentum in the U.S. and global economy evident in recent surveys has subsided,” Jamie Dimon, chief executive officer of JPMorgan Chase & Co. in New York and vice chairman of the Business Council, said in a statement. “Members sent a strong message about increasing government regulation and intervention,” and “the federal budget deficit remains a critical concern,” he said.

"Gold is a Bubble" not

Trade Deficit, Back to the Future (redux)

U.S. Trade DeficitThe blue line is the total deficit, and the black line is the petroleum deficit, and the red line is the trade deficit ex-petroleum products.

The increase in the deficit in August was due to both oil and China, although the bulk of the increase was because of trade with China. The trade deficit with China increased to $28.0 billion in August from $25.9 billion in July (NSA).

The imbalances have returned ...

Setting Straight the BS from the BLS

Wednesday, October 13, 2010

New "Pulse of Commerce Index" -

This is the new UCLA Anderson Forecast and Ceridian Corporation index using real-time diesel fuel consumption data: Pulse of Commerce IndexTM

Pulse of Commerce IndexClick on graph for larger image in new window.

This graph shows the index since January 1999.

This is a new index, and doesn't have much of a track record in real time, although the data suggests the recovery has "stalled" since May.

Press Release: Economy Devoid of Momentum: Ceridian-UCLA Pulse of Commerce Index™ Declines for Second Consecutive Month in September
The Ceridian-UCLA Pulse of Commerce Index™ (PCI), a real-time measure of the flow of goods to U.S. factories, retailers, and consumers,fell .5 percent in September after falling 1.0 percent in August, which is the first time the index has experienced a consecutive monthly decline since January 2009. Furthermore, August and September 2010 together produced the worst combined two-month decline since the recessionary months of January and February 2009.

The decline indicates four consecutive months of limited to no increases in over the road movement of produce, raw materials, goods-in-process and finished goods since the PCI peaked in May 2010. Moreover, the PCI forecasts GDP growth in the third quarter of 2010 at an anemic 0.7 percent to 1.7 percent, below the PCI’s previous 1.5 to 2.5 percent estimate reported last month (which at the time approximated the consensus economic view). The PCI forecast of the Federal Reserve's monthly Industrial Production (IP) index (to be released later this month) also signals IP growth for September to be very close to zero with an even odds chance for a negative number.

Google Trends Says Recession Never Ended

Preview of Coming Attractions

On Friday, Fed Chairman Ben Bernanke will speak at the Federal Reserve Bank of Boston Conference "Monetary Policy Objectives and Tools in a Low-Inflation Environment".

Jon Hilsenrath at the WSJ has a preview: Fed Chief Gets Set to Apply Lessons of Japan's History 
Mr. Bernanke is preparing for a potentially important policy speech Friday, when he could detail his thinking on the Fed's next steps ... The conference is a reprise of a 1999 conference at which Mr. Bernanke and other academics took Japanese officials to task for failing to get their economy moving.

Tuesday, October 12, 2010

NFIB Survey Charts

By request, here are a few graphs based on the NFIB press release: Small Business Optimism Index Remains at Recessionary Level

Small Business Optimism IndexClick on graph for larger image in new window.

The first graph shows the small business optimism index since 1986. Although the index increased slightly in September, it is still at recessionary level according to NFIB Chief Economist Bill Dunkelberg who said: "The downturn may be officially over, but small business owners have for the most part seen no evidence of it."

Small Business Hiring PlansThe second graph shows the net hiring plans over the next three months.

Hiring plans have turned negative again. According to NFIB: "Over the next three months, eight percent plan to increase employment (unchanged), and 16 percent plan to reduce their workforce (up three points), yielding a seasonally adjusted net negative three percent of owners planning to create new jobs, down four points from August."

Small Business Poor SalesAnd the third graph shows the percent of small businesses saying "poor sales" is their biggest problem.

Usually small business owners complain about taxes and regulations (that usually means business is good!), but now their self reported biggest problem is lack of demand.

Friday, October 8, 2010

More Pics

[Chart]

THIS IS VERY POWERFUL

Percent Job Losses During Recessions, aligned at Bottom

Percent Job Losses During RecessionsClick on graph for larger image.

This graph shows the job losses from the start of the employment recession, in percentage terms - this time aligned at the bottom of the recession (Both the 1991 and 2001 recessions were flat at the bottom, so the choice was a little arbitrary).

Back to the Future...U-6 rises to 17.1% (again!)

Oh, Joy

Diffusion Indexes

This is a little more technical ...

Employment Diffusion IndexThe BLS diffusion index for total private employment declined to 49.8 from 54.1 in August. For manufacturing, the diffusion index declined to 46.3 from 48.2 in August.

Both indexes are down sharply from earlier this year.

Think of this as a measure of how widespread job gains are across industries. The further from 50 (above or below), the more widespread the job losses or gains reported by the BLS. From the BLS
Figures are the percent of industries with employment increasing plus one-half of the industries with unchanged employment, where 50 percent indicates an equal balance between industries with increasing and decreasing employment.

Thursday, October 7, 2010

Then we came across this surreal column in the op-ed article of yesterday’s NYT 
by Daniel Gross.  His message is that “the new frugality is a myth — and that's 
good for the economy.”  He adds, “for this recovery to mature, broaden and 
persist, the greatest economic force known to mankind — the American 
consumer — has to get back in the game.”  
Wow.  Talk about playing by the old rules.  There was no mention in the article 
the fact that with a 70% share of GDP, the U.S. consumer never exactly went 
into hibernation, even if spending decisions have changed.  
Then he goes on to extol the virtues of debt (what would Kant say?) and longs 
for the days when we collectively lived beyond our means: “The renewed 
willingness and confidence to spend money we don’t have is vital to the 
continuing recovery.”  
Huh?  And I thought employment and income were the vital components to 
sustainable growth.   
Then Mr. Gross goes on to say — brace yourself: “Money may make the world go 
'round, but credit makes the gears of commerce run smoothly.”  
Yes, sure it does.  Up until you reach a point where 30% of the population have a 
sub-620 FICO score.   
But listen to this ... the coup-de-grace: “As the economy slowly recovers, there 
are signs that Americans are rediscovering their free-spending ways.  Total 
consumer credit, which includes non-revolving debt like car loans, have 
stabilized, and it rose in both June and July.  It’s back to where it was in the 
second quarter of 2009.” 
What?   

CdeR: wow, combine the above with NY Fed VP Brian Sack's comments that lifting asset
prices higher than they would be via Fed asset purcahses "would be a good thing" and you
get a glimpse into the crack addicted economy that is the USA.

Wednesday, October 6, 2010

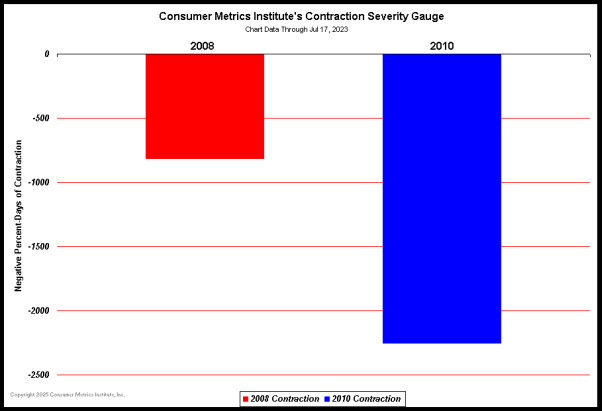
KEEP AN EYE ON THIS, CMI INDEX CONTINUES TO WEAKEN!!!

What a Currency War Really Means

Beggar thy neighbor FX policy is akin to trying to steal jobs from other countries. This never ends well.

How do some folks find their way to work each day?

I was listening to some guy on Bloomberg extolling the virtuous circle of corp profits and piles of cash...this guest was so bulled up! But he's reading the wrong signs...profits are a lagging, not a leading indicator. Please look again at the earlier posts from Consumer Metrics...and look at today's ADP report and the revised IMF FORECAST for the USA. Tells another story, no?

Currency War, Redux

----- Original Message -----
From: Douglas Borthwick
Sent: Tue Oct 05 23:44:12 2010
Subject: Friday IMF Side Meeting

We are increasingly interested in the Currency-Focussed Side meeting that has been arranged at the IMF Meeting on Friday.  We note that with the weakening USD and increased talk of trade wars, that the possibility of a new 'Plaza' Accord is now not out of the question.  We note that at the time of the Plaza Accord the US Current Account as a %age of GDP was running at 3-3.5%.  In Q2 2010 the US current account as a %age of GDP was 3.4% of GDP.  Also going into the Plaza Accord, interest rates were near all time lows in most countries, a similar situation to today.  In 1985 Germany and Japan financed the US deficits through purchasing US fixed income.  This time around China and Japan are the primary financiers.  Following the Plaza Accord Japan and Europe saw their currencies strengthen by 50% and the US weakened by the same amount.  With a Current Account deficit at elevated levels once more, interest rates at near lows and trade wars looming another Accord may be on the near-term horizon

We are really that dumb!? USA favors Japan over China

http://www.reuters.com/article/idUSTRE6951V820101006

Friday, October 1, 2010

ISM Mfg

ISM PMI Aug 2010Click on graph for larger image in new window.

Here is a long term graph of the ISM manufacturing index.

In addition to the decrease in the PMI, the ISM's new orders index fell to 51.1 from 53.1 in August, and the production index declined to 56.5 from 59.9.

The employment index declined to 56.5 from 60.4 in August.