Wednesday, June 30, 2010

CMI explains why they think their methodology works

June 29, 2010 - What the Revised 1st Quarter GDP Numbers Really Mean:

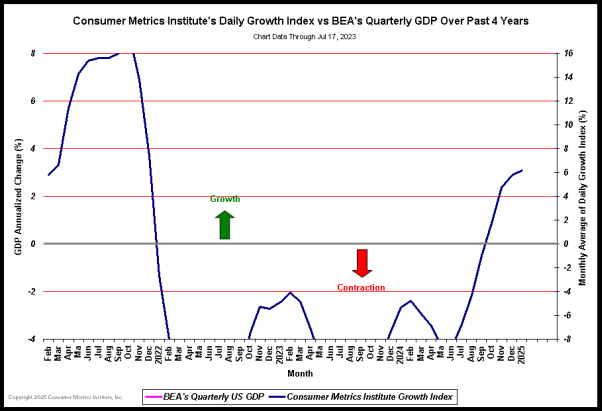
On June 25th the BEA quietly revised its measurement of GDP growth for the first quarter of 2010 down for the second time, this time to 2.7%. The newly revised growth estimate nearly matches the Consumer Metrics Institute's original projection for the first quarter, which was 2.62%. The big difference is that the Consumer Metrics Institute's projection (based on our Daily Growth Index) was available on November 30, 2009 -- seven months ago.

Chart
(Click on chart for fuller resolution)


Because the Consumer Metrics Institute's Daily Growth Index only lags the real-time consumer economy by several days and has a day-by-day time resolution, the Daily Growth Index can also tell us something totally missing in the BEA report: that the newly revised GDP 'freeze frame' picture captures a moment in time when consumer demand was dropping at a rate of about .08% per day. This means that the difference between the revised GDP and our original projection represents only a single day of economic change. But more importantly, our Daily Growth Index shows the dynamics of the economy at the point in time when the BEA 'still picture' was taken.

One other important note should be made about the June 25th BEA release: in it the BEA also increased the inventory component within the 2.7% number from 1.65% to 1.88%. That means that the net-after-inventory-adjustments number was less than 0.9%, and over two-thirds of the reported aggregate growth was from relatively unpredictable inventory swings.

If factories were unwittingly growing inventories during the first quarter in the face of what was really slackening consumer demand, the official GDP numbers for both the second quarter and the third quarter (to be released 4 days before the U.S. mid-term elections) could be interesting, since factories could very well over-correct again -- but in the opposite direction.

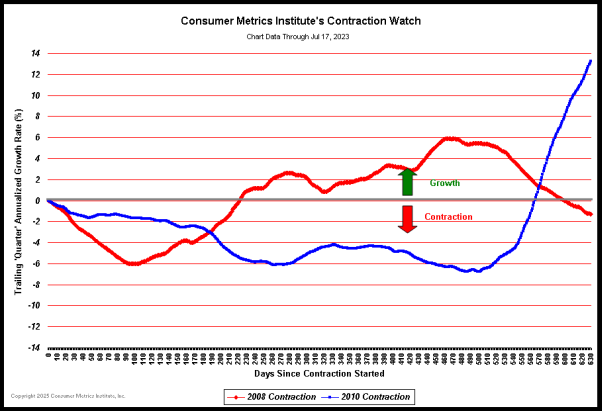
Because Friday's BEA release mirrors our Daily Growth Index from November 30th, the index's subsequent course provides some insight into where the economy has been heading since then. Roughly half a quarter later (on January 15th, 2010) the index fell into net year-over-year contraction. During the nearly two quarters since then the index has been showing mild but continued contraction. When that contraction is charted along with similar contraction 'events' from 2006 and 2008 it can be seen that 2010 is shaping up as wholly unique:

Chart
(Click on chart for fuller resolution)


As the chart shows, the current contraction has progressed for nearly two quarters without yet tracing a clearly formed bottom. And any measure of the severity of an economic slowdown must include not only maximum rate of contraction, but duration as well. Although the 2010 event has been milder than 2008 in terms of absolute negative growth rates observed, if it progresses long enough the aggregate economic pain could be substantial. For a little perspective, the total economic impact of 2010's contraction is already nearly twice what was experienced in 2006, when the GDP slipped to a barely positive +0.1% growth rate. And (to date) the total economic impact of the 2010 event represents nearly a full third of the pain experienced during the 'Great Recession' of 2008-2009.

The key message to take from these numbers is that the fundamental change in consumer behavior which we have been observing over the past three quarters is likely to be protracted. Although this change in behavior is most clearly shown in our data by consumer reluctance to take on new or increased debt, it probably reflects de-leveraging much more than balance sheets -- almost certainly including de-leveraged consumer expectations for the near future.

At the Consumer Metrics Institute we measure day-by-day changes in the discretionary durable goods transactions of internet shopping consumers. We genuinely believe that the real economy lives where 'Main Street' consumers are (figuratively and/or literally) clicking 'Add to Shopping Cart', not where the BEA's factories slavishly follow the consumer's lead. The millions of consumers we measure respond collectively to what they see going on with their own local economy, family and friends. And right now real-world 'Main Street' consumers are demonstrating significant caution. 
5

ADP rept miserable


ADP Employment Report
Released on 6/30/2010 8:15:00 AM For Jun, 2010
PriorActual
ADP employment55,000 13,000 
Highlights
ADP estimates private payrolls will rise only 13,000 in June vs. its revised estimate of 57,000 in May (plus 55,000 first reported).

Chicago PMI in line


Chicago PMI
Released on 6/30/2010 9:45:00 AM For Jun, 2010
PriorConsensusConsensus RangeActual
Business Barometer Index - Level59.7 59.7 57.0  to 62.9 59.1 
Highlights
Orders are moving into production in what is another very strong Chicago purchasers report. The headline composite edged back six tenths in June to 59.1, well over 50 to indicate significant month-to-month growth for the area's business activity. Production rose more than three points to a very strong 64.2 with employment up five points to a 54.2 reading that indicates month-to-month hiring.

New orders keep coming in though at a slightly slower rate, at 59.1 vs. a prior string of 60 readings. New orders, given the increase in production, are not moving into backlog which shows only a marginal monthly increase at 50.7. Businesses drew down their inventories in the month with the reading down nearly 10 points to 46.5. The inventory draw likely reflects a combination of production needs and still conservative business management. Deliveries, at 60.7, continue to slow but at an easing rate compared with April and May when the reading was in the mid 60s. Input prices, at 61.9, accelerated at a slightly less aggressive rate than prior months.

Tuesday, June 29, 2010

Consumer Confidence Plummets

The Conference Board Consumer Confidence Index® which had been on the rise for three consecutive months, declined sharply in June. The Index now stands at 52.9 (1985=100), down from 62.7 in May.
...
Says Lynn Franco, Director of The Conference Board Consumer Research Center: “Consumer confidence, which had posted three consecutive monthly gains and appeared to be gaining some traction, retreated sharply in June. Increasing uncertainty and apprehension about the future state of the economy and labor market, no doubt a result of the recent slowdown in job growth, are the primary reasons for the sharp reversal in confidence. Until the pace of job growth picks up, consumer confidence is not likely to pick up.”

Saturday, June 26, 2010

Bank Failure Friday

Overall, the Unofficial Problem Bank List stands at 797 institutions with aggregate assets of $409.6 billion, up from 781 institutions with assets of $404.5 billion last week. Removals include the failed Peninsula Bank ($644 million), First National Bank ($253 million), and High Desert State Bank ($83 million). The FDIC terminated actions against De Witt State Bank ($39 million), Citizens State Bank of Lankin ($37 million), BankHaven ($22 million), and The Farmers Bank ($18 million). The other removal was for VisionBank of Iowa ($87 million) which merged with its affiliate sister bank -- Ames Community Bank ($383 million) that also happens to be on the Unofficial Problem Bank List as it is operating under a Written Agreement.

There were 24 institutions with aggregate assets of $6.5 billion added to the list this week. Notable additions include Bank of Choice, Greeley, CO ($1.3 billion); Nova Bank, Berwyn, PA ($598 million); CornerstoneBank, Atlanta, GA ($536 million); and Sterling Federal Bank, F.S.B., Sterling, IL ($501 million). Geographically, five institutions from Georgia, three from Missouri, and two from California, Colorado, Illinois, and Pennsylvania were added.

Friday, June 25, 2010

Truck tonnage fell in May (as did Rail)

Truck Tonnage Index

ECRI plunges (again!)....this is one to watch


It's getting close: the fabled -10% annualized change (see David Rosenberg) which guarantees a recession is now just 3.1% away, which at this rate of collapse will be breached in two weeks. The ECRI is now at December 2007 levels, the time when the last recession officially started. The index dropped from an annualized revised -5.8% (previously -5.7%) to -6.9%. As a reminder, from Rosie, "It is one thing to slip to or fractionally below the zero line, but a -3.5% reading has only sent off two head-fakes in the past, while accurately foreshadowing seven recessions — with a three month lag. Keep your eye on the -10 threshold, for at that level, the economy has gone into recession … only 100% of the time (42 years of data)." We are practically there.

C. deR comment:  does anybody REALLY believe that the politicians are going to wait around to see if their newly found deficit reticence is combined with a double dip??  I, for one, think not.  The deficit growth route is blocked, and that leaves only one avenue open, politically speaking.

GDP about to Collapse???

Ben, it's time to stop fixating on credit, and start thinking like a monetarist. - CdeR

Most important piece of the decade

Daily Telegraph: Is the Fed readying another money blitz????

Thursday, June 24, 2010

THe Consumer behaving different this time


June 13, 2010 - Consumer Demand Slowdown Gets Even Weirder :

We have been commenting for some time that the profile of the current year-over-year contraction in consumer demand has been unique when compared to similar events in 2006 and 2008. The differences have only become more distinct as time has progressed:


► The 2010 event has now gone on for nearly 150 days without forming a bottom. The 2006 event had already completely ended by the 110th day, while the much more severe 2008 event had at least formed a bottom by the 120th day. In contrast the downward slope of the 2010 event increased after passing the 140th day.

► The 2010 event has now passed the 2006 event in terms of maximum level of contraction. In 2006 our 'Daily Growth Index' bottomed at a year-over-year contraction rate of -2.28% on August 25th. On June 10th, 2010 our 'Daily Growth Index' dropped below that level for the first time during the current slowdown.

► The severity of contraction events is the product of the average negative 'growth' rate observed and the duration of the negative 'growth' period. This means that the two-dimensional 'area under the curve' is the best true indication of how much economic pain is associated with each event. In 2006 our 'Daily Growth Index' had a total of about 136 negative-percent-days of contraction over the 110 day event, and the BEA's measurement of the GDP dropped to a barely positive .1% growth for the third quarter of 2006. During the current 2010 contraction event we have already accumulated over 210 negative-percent-days of contraction during the first 148 days, a figure that is more that 50% greater than in 2006 and still growing. (To keep these figures in perspective, however, the 2008 event reached 794 negative-percent-days of contraction over 223 days. This means that the current slowdown, although already 2/3 the length of the 2008 event, has to this date inflicted only about a quarter of the damage to the economy as experienced in 2008.)

► What is troubling to our eyes is that the shape of the current curve is clearly different from both the 2006 and 2008 events, which were similar except for scale. Put bluntly, our recent past experience with contraction events can offer no predictions as to where we are headed now. Something is structurally different this time.

Friday, June 18, 2010

ECRI plunges....this is one to watch


The ECRI weekly leading index is continuing its accelerating dive, and is now well into negative territory, hitting -5.7 for the past week: a 2.2 decline from the prior week. Here is why, as David Rosenberg, this is a critical indicator, and why we may have just 4.3 more points to go before the critical -10 threshold: "It is one thing to slip to or fractionally below the zero line, but a -3.5% reading has only sent off two head-fakes in the past, while accurately foreshadowing seven recessions — with a three month lag. Keep your eye on the -10 threshold, for at that level, the economy has gone into recession … only 100% of the time (42 years of data)." At this rate of decline -10 will be taken out in the first week of July.
And some more recent observations on ECRI from Rosie:
Suffice it to say, when the ECRI was drifting lower in 2007, it got to -3.5%, where are we are now, in November and unbeknownst to the consensus at the time that a recession was only one month away. Remember that the economics community did not call for recession until after Lehman collapsed — nine months after it started; and go back to 2001, and the consensus did not call for recession until after 9/11 and again the economy had been in recession for a good six months).

Tuesday, June 15, 2010

Retail? Not so much


Released on 6/15/2010 8:55:00 AM For wk6/12, 2010
PriorActual
Store Sales Y/Y change3.6 %2.7 %
Highlights
Redbook reports a slowing in consumer spending. Year-on-year same-store sales came in at plus 2.7 percent in the June 12 week, down from 3.6 percent in the prior week. The report says traffic is down and warns consumers are cutting back again on discretionary spending. Redbook estimates sales are down 0.5 percent from this time last month indicating another month of trouble for the retail sales report.

Friday, June 11, 2010

Trapped??

Fed trapped
(1) Stand back and let everyone go bankrupt in a deflationary collapse. This is the classical solution. You could then reorganize and not have wasted 20 years. This is brief, terrible and politically untenable.
-or-
(2) Print new base money immediately. This will seemingly be inflationary but in reality you are only pulling the money supply along to keep up with the asset inflation that has *already* occurred. Some debt may be destroyed by inflation but it is much less disruptive if it is at low levels.

Bill Gross pushed this very well in March 2009.

Gross said in order to deal with the debt load, we need a “return to nominal GDP growth levels of 5-6%, the majority of which might actually come in the form of higher prices as opposed to increased production. This Faustian bargain would be acceptable if only to stabilize what now appears to be an even more dangerous deflationary debt liquidation.”
Posted by DanHess | Report as abusive

Monday, June 7, 2010

This is just too good to miss - Rosie

We highly recommend The Deflation Dilemma (page 18) and A Winding Path to 
Inflation (page 84) of the current Economist.  The second article is particularly 
enlightening because it shows how ineffective a policy aimed at creating 
inflation will be because the bond maturity profile of most industrialized 
countries is short.  Over half of U.S. government debt and 40% in Germany and 
France roll over within the next three years and so an overt policy to inflate away 
the massive public debts will be self-defeating if the bond vigilantes demand a 
higher premium upon refinancing time.  Besides, an inflation-is-always-around- 
the-corner culture still permeates most central banks: the Bank of Canada 
hiking, the Fed district banks clamouring for a rate hike, the tightening moves 
this year by India, Brazil and China, as well as the refusal on the part of the ECB 
to go beyond shifting the composition of its balance sheet and actually expand it 
in a classic quantitative-easing style.     

Parades and Rain - Rosie

A FEW MORE DISTURBING EMPLOYMENT TIDBITS  
First, if it weren’t for the plunge in the labour force, the U.S. unemployment rate 
would have climbed to 10% in May.  Second, the Household survey actually 
flagged a 35,000 outright decline in employment last month.  Third, the 41,000 
increase in private payrolls, about one-third of what was widely expected and the 
low-water mark for the year, was exaggerated by a 29,000 boost from the “birth- 
death” model.  Fourth, the fact that the hottest sector of the economy, 
manufacturing, could only post a 29,000 gain, a sharp slowing from 40,000 in 
April is quite disconcerting — especially since it is clear that the ISM index has 
peaked for the cycle.  Fifth, the declines in the financial sector, construction and 
State/local governments are a vivid reminder that the parts of the economy that 
were most affected by the bursting of the housing and credit bubble are still 
licking their wounds and cannot be relied upon to play any role in helping revive 
what is still very much a moribund jobs market.   
It’s not just the labour market that is behaving poorly, but the housing market is 
too.  It is remarkable that with interest rates so low that we would be seeing 
mortgage applications for new purchases down to a 13-year low.  Take a look at 
page A6 of the weekend WSJ and you will see that Ivy Zelman, the country’s best 
housing analyst, is calling for nationwide home sales to slide between 25% and 
30% in May and that is sequential, not year-on-year (that is very close to a 100% 
annual rate plunge.  Even the usually optimistic National Association of Realtors 
is expecting “June and July to remain fairly weak”).  A survey conducted by Credit 
Suisse (released on Friday) showed that in stark contrast to the latest National 
Association of Home Builders survey, the traffic of prospective homebuyers in 
May was back to depths of late 2008 when the financial crisis was in full gear. 


Saturday, June 5, 2010

We aren't in Kansas Anymore..Jobless duration, since the 70s


Debt/GDP


US Total Government Debt Reaches 130% of GDP


Here's a postcard from off-balance-sheet country.

This includes only current debt and not future unfunded obligations.

I like to call this US debt chart "The Last Bubble," but it could equally apply to a chart showing the representation of this debt - the US bonds, notes, bills and of course dollars, which are really nothing more than Federal Reserve Notes of zero duration in the modernfiatopia.

It all adds up, eventually, and must be reconciled. It is easier to print money and accumulate debt when you own the world's reserve currency. For a while the dollar might even flourish, despite the printing, as the international savers flee ahead of the economic hitmen, from country to country, and crisis to crisis.

Friday, June 4, 2010

Percent job losses aligned at bottom

This is a stunner, the dotted line is corrected for the Census Hires:

More on the NFP

Employment-Population Ratio

The Employment-Population ratio decreased to 58.7% in May (from 58.8% in April). This had been increasing after plunging since the start of the recession. This is about the same level as in December 1983.

Employment Population RatioThis graph shows the employment-population ratio; this is the ratio of employed Americans to the adult population.

Notethe graph doesn't start at zero to better show the change.

The Labor Force Participation Rate decreased to 65.0% from 65.2% in April. This is the percentage of the working age population in the labor force. This decline is disappointing, and the rate is well below the 66% to 67% rate that was normal over the last 20 years. 

JPMorgan Econ Call

U.S. Economic Outlook on Friday, June 4, 2010, at 10:00am ET/ 15:00 UK, Hosted by: Bruce Kasman (J.P. Morgan Chief Economist), Dial in: 888-793-8857 (US); +1-773-681-5987 (outside US); Passcode: 6909591, Replay through 6/12: 888-458-8113 (US); +1-402-998-1351 (outside US); Passcode: 6909591 (PODCAST AVAILABL

Graph showing data ex Census hires

See the dotted line!!! (click on graph to enlarge)

Percent Job Losses During Recessions

Thursday, June 3, 2010

Euro CDS spreads start to widen....again.

Spreads dropped after shock & awe, but have now started to widen again, particularly at the periphery.  It looks like Hungary is next?


NFP Friday


Released on 6/4/2010 8:30:00 AM For May, 2010
PriorConsensusConsensus Range
Nonfarm Payrolls - M/M change290,000 540,000 225,000  to 635,000 
Unemployment Rate - Level9.9 %9.8 %9.7 % to 9.8 %
Average Hourly Earnings - M/M change0.0 %0.1 %0.0 % to 0.2 %
Av Workweek - All Employees34.1 hrs34.1 hrs34.1 hrs to 34.2 hrs

Hungary joins the parade...


Forint Slides as Hungary admits they are in the same shape as Greece:
5

5


Jobless Outlook by State


Since tomorrow is the big NFP report, lets take a look at this EPI breakdown of Unemployment by State.
They note that “while the median duration of unemployment represents the typical job search, it also means that the wait is longer for half of all unemployed workers.” Hence, many of these workers will exhaust 26 weeks of unemployment insurance before landing a permanent new gig.
That has significant repercussions for consumer spending, foreclosures, etc.

Foreclosure Games

The average borrower in foreclosure has been delinquent for 438 days before actually being evicted, up from 251 days in January 2008, according to LPS Applied Analytics.
...
More than 650,000 households had not paid in 18 months, LPS calculated earlier this year. With 19 percent of those homes, the lender had not even begun to take action to repossess the property 

ISM non-mfg flat, but employment ticked up.

The May ISM Non-Manufacturing index was at 55.4%, unchanged from April (slightly below expectations). The employment index showed some growth after 28 consecutive months of contraction. 

Tuesday, June 1, 2010

Consumer Metrics Shows Economy Contracting by Q3

May 30, 2010 - BEA Lowers 1st Quarter GDP Estimate as the Consumer Metrics Institute Previews 3rd Quarter GDP:

On May 27th the BEA released its first revision to its 1st Quarter 2010 GDP growth rate measurement, lowering the number from a 3.2% annualized growth rate to 3.0% annualized growth. One day later the Consumer Metrics Institute's 'Daily Growth Index' was signalling what we should expect the BEA's measurement of the 3rd Quarter 2010 GDP growth rate to be: contracting at about a 2.0% rate.

The prior BEA estimate of 1st Quarter 2010 GDP growth trailed our 'Daily Growth Index' by 127 days, and because of the rapid rate that the economy was cooling when the measurements were being made the newly adjusted estimate is now trailing our 'Daily Growth Index' by 125 days. Since the 3rd Quarter of 2010 ends 125 days after May 28th (when our 'Daily Growth Index' was recording a 'growth' rate of -1.99%), if the BEA estimates continue to trail our 'Daily Growth Index' in a consistent manner we should expect that the 3rd Quarter's GDP 'growth' rate will be in the -2.0% neighborhood.