Saturday, January 8, 2011

SNAP

h/t john lohman
4.95652

Friday, January 7, 2011

Follow up on the NFP

Here are a few more graphs based on the employment report ...

Percent Job Losses During Recessions

Percent Job Losses During RecessionsClick on graph for larger image.

This graph shows the job losses from the start of the employment recession, in percentage terms - this time from the start of the recession.

In the previous post, the graph showed the job losses aligned at the bottom.

The dotted line shows payroll employment excluding temporary Census workers.

This is by far the worst post WWII employment recession.

Part Time for Economic Reasons

Part Time WorkersFrom the BLS report
The number of persons employed part time for economic reasons (some-times referred to as involuntary part-time workers) was essentially unchanged in December at 8.9 million. These individuals were working part time because their hours had been cut back or because they were unable to find a full-time job.
The number of workers only able to find part time jobs (or have had their hours cut for economic reasons) declined slightly to 8.931 million in December. This has been around 9 million since early 2009 - a very high level.

These workers are included in the alternate measure of labor underutilization (U-6) that declined to 16.7% in December. Still very grim.

Unemployed over 26 Weeks

Unemployed Over 26 WeeksThis graph shows the number of workers unemployed for 27 weeks or more. 

According to the BLS, there are 6.441 million workers who have been unemployed for more than 26 weeks and still want a job. This was up from 6.328 million in November. It appeared the number of long term unemployed had peaked, however the increases over the last three months are very concerning. 

Summary

This was a mixed report.

The best news was the decline in the unemployment rate to 9.4% from 9.8% in November. However this was partially because the participation rate declined to 64.3% - a new cycle low, and the lowest level since the early '80s. Note: This is the percentage of the working age population in the labor force (here is the graph in the galleries of the participation rate). 

The 103,000 payroll jobs added was below expectations of 140,000 jobs, however payroll for October payroll was revised up 38,000 and November was revised up70,000 32,000 for a total of 70,000 (ht Mish). 

The increase in the long term unemployed, and the high level of part time workers for economic reasons are ongoing concerns. The average workweek was steady at 34.3 hours, and average hourly earnings ticked up 3 cents.

• Earlier Employment post: December Employment Report: 104,000 Jobs, 9.4% Unemployment Rate

Payroll Preview for today

The BLS will release the December Employment Report at 8:30 AM tomorrow. The consensus is for an increase of 140,000 payroll jobs in December, and for the unemployment rate to decline to 9.7% (from 9.8% in November).

Gregg Robb at MarketWatch reports there have been some upward revisions:Optimism over government’s job report grows
Economists polled by MarketWatch are now expecting 175,000 nonfarm jobs created in December, up from 143,000 just a few days ago.

The unemployment rate is expected to remain steady at 9.8%.
Payroll Jobs per MonthClick on graph for larger image in graph gallery.

This graph shows the net payroll jobs per month (excluding temporary Census jobs) since the beginning of the recession. The estimate for December is in blue.

Last month the BLS reported a disappointing 39,000 jobs added in November. That was significantly below expectations of 145,000 jobs.

However - as always - we should be careful not to read too much into any one month of data. A good example was in 1997. The economy added 280,000 jobs per month on average, but in August 1997 the BLS reported a decline of 18,000 jobs! Was the employment boom over? Nope. The following month the BLS reported a gain of 508,000 jobs.

And that also suggests the possibility of some bounce back from November (or an upward revision to the November payroll numbers).

Here is a look at a few of the recent employment related reports:

• ADP reported Private Employment increased by 297,000 in December, the largest gain ever for the ADP series (started in 2001). This was well above expectations of 100,000 private sector jobs - and there is widespread skepticism that the economy actually added anywhere near that number of jobs. Andrew Tilton at Goldman Sachs noted yesterday: 
[W]e view the dramatic improvement shown in the ADP report with skepticism ... while we do expect a meaningful pickup in employment growth in 2011, we have not changed our forecast of a 100,000 increase in nonfarm payrolls in December.
Weekly Unemployment Claims• Weekly initial unemployment claims were down significantly over the last couple of months.

The average over the last 5 weeks was 413,000 initial claims per week.

This was down sharply from the October the average of 456,000, and the November average of 431,000.

NFIB outlook positive

From National Federation of Independent Business (NFIB): Small Business Hiring Stagnant in December; Likely to Improve in 2011 
“Reports of net job creation continued to oscillate around the “0” line in December. Asked about changes in total employment over the last three months, 13 percent of owners reported increasing employment at their firms by an average of 3.5 workers while 14 percent reported (down two points from November) reducing total employment an average of 2.9 workers per firm. Clearly, December showed no surge in small business hiring. ... Still, the percentage of owners reporting higher employment levels is the second highest reading since December 2007...

“The good news is that the two job creation indicators, job openings and job creation plans, both reached new recovery highs. The percent of owners reporting hard to fill job openings rose four points to 13 percent, the best reading in 24 months. Plans to create jobs gained two points, rising to a net 6 percent of all owners, the best reading in 27 months. These indicators point to a pickup in job creation activity for the first quarter of 2011. However, the small business sector continues to underperform on job creation in this recovery compared to other recovery periods.”
NFIB will release their December Small Business Optimism survey on Tuesday. 

Thursday, January 6, 2011

Monster Jobs Index

Monster Employment Index134 130 
Highlights
The Monster employment index fell four to 130 to indicate slowing volume of online recruitment in December. The report notes state and local government hiring continues to slow.

Monday, January 3, 2011

Italy Hits the Red Zone

Yields on 10-year bonds rose 10 basis points to 4.86pc after a poor auction of short-term debt in Rome. The Italian treasury had to pay 1.7pc to sell €8.5bn (£7.2bn) of six-month bills in a thin post-Christmas market, up from 1.48pc a month ago.
The spike in rates came as money supply data released by the European Central Bank showed that real M1 deposits have collapsed at a rate of 2.8pc over the last six months in the EMU bloc of Italy, Spain, Greece, Ireland and Portugal, even though they are rising in northern Europe.

Italy is too big to be rescued by a diminishing group of creditor states in the EMU core, should it ever need help. Public debt will creep up to 120pc of GDP next year – or over €1.9 trillion – a level widely seen as the outer limit of debt sustainability.
The country's trump card is a high savings rate and low private debt. Total debt is 245pc of GDP, below the eurozone average, and much lower than in Spain, Britain, the US or Japan. This may be the relevant indicator for an economy as a whole.
However, low private debt may equally reflect deep pessimism in a country where growth has been glacial for a decade, productivity has fallen since 1995, and global export share is in steep decline.

Construction Spend Still Sluggish

Private Construction SpendingClick on graph for larger image in new window.

This graph shows private residential and nonresidential construction spending since 1993. Note: nominal dollars, not inflation adjusted.

Private residential spending increased in November; private non-residential construction spending is still declining. 

Deliquencies Drifting Downwards

Delinquency RateThis graph provided by LPS Applied Analytics shows the percent delinquent, percent in foreclosure, and total non-current mortgages through November.

The percent in the foreclosure process is trending up because of the foreclosure moratoriums. 

According to LPS, 9.02% of mortgages are delinquent (down from 9.29% in October), and another 4.08% are in the foreclosure process (up from 3.92% in October) for a total of 13.10%.

Wednesday, December 22, 2010

Pritchard, reasons to be fearful, Part 3

Click HERE for story

Re-Fi index plunges

The Refinance Index decreased 24.6 percent from the previous week. The Refinance Index has declined six straight weeks and is at its lowest level since the week ending April 30, 2010. The seasonally adjusted Purchase Index decreased 2.5 percent from one week earlier.
...
The average contract interest rate for 30-year fixed-rate mortgages increased to 4.85 percent from 4.84 percent, with points decreasing to 0.96 from 1.33 (including the origination fee) for 80 percent loan-to-value (LTV) ratio loans.
MBA Purchase Index

Home Inventories

Year-over-year InventoryClick on graph for larger image in graph gallery.

Although inventory decreased from October to November, inventory increased 5.4% YoY in November. 

The year-over-year increase in inventory is especially bad news because the reported inventory is very high (3.71 million), and the 9.5 months of supply in November is well above normal. 

Friday, December 10, 2010

IEA Raises Oil Forecast to the Second biggest increase in 30 yrs.


IEA raises forecast for global oil demand

ByJavier Blas, Commodities Editor
Published: December 10 2010 09:53 | Last updated: December 10 2010 09:53
Global oil demand will grow more this year than previously expected, the International Energy Agency said on Friday, putting pressure on the Opec oil cartel to boost supplies and stop prices from hitting $100 a barrel.
The western countries’ oil watchdog said that “against a backdrop of much-stronger-than-expected global oil demand”, Opec “may come under pressure to increase supplies to the market in the new year if prices continue their relentless rise”.
Opec meets on Saturday on Quito, Ecuador, to discuss its production policy. The warning is the first clear indication that after two years restraining output to avoid a decline in oil prices during the global financial crisis, the cartel’s next job will be to decide when to open the spigots and by how much to control rising oil prices.
The IEA revised upwards its estimate for global oil demand for this year and 2011 on the back of stronger-than-expected demand in North America and China.
The Paris-based agency forecast consumption rising this year by 2.5m barrels a day, the second-highest annual increase in at least 30 years, and about 130,000 b/d more than the figure given in last month’s update. For 2011, the IEA forecast oil demand would rise by 1.3m b/d, or about 260,000 b/d above its previous forecast.
“Although economic concerns remain skewed to the downside – not least if current high prices begin to act as a drag on growth –, more immediately demand could surprise to the upside,” the IEA said in its monthly editorial comment. “Recent harsh northern hemisphere weather, allied to electric power rationing in China, if sustained, could push short-term demand higher and tighten market balances further,” it added.

Thursday, December 9, 2010

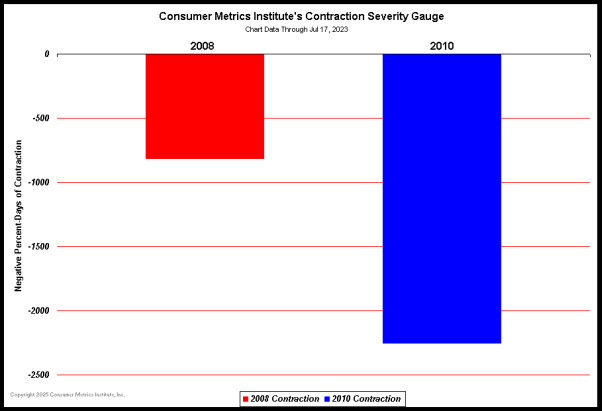
CMI metrics turn sharply higher

http://www.consumerindexes.com/commentary_2010_contraction_watch_full.png

Wednesday, December 1, 2010

Wednesday, November 10, 2010

Friday, November 5, 2010

Last Week

Positives
1) Oct payrolls surprise big to the upside
2) Fed lights another fire under asset prices but are we really wealthier as a result?
3) Emerging markets continue to rally as investors seek non $ assets
4) Oct auto sales rise to best since Sept ’08 ex clunkers
5) ISM services and mfr’g indices both above forecasts
6) RBA and RBI raise rates to cool inflation pressures
7) Fed to allow healthy banks pay dividends.
Negatives
1) Huge printing of money has turned our central bank into a 3rd world one
2) Asset priced induced wealth effect is an illusion if a debased currency and higher inflation is the side effect
3) Deeper the Fed gets, the more difficult it will be to reverse
4) Commodity inflation as measured by CRB index rises to 2 year high
5) Ireland, Portugal and Greece financial concerns continue to grow
6) German Sept factory orders fall sharply
7) Sept Pending Home Sales unexpectedly fall.

Wednesday, October 27, 2010

This Chart Doesn't Compute! (vs. earlier recessions)

Typically BEFORE the end of every recession, new home sales rise sharply, and keep rising afterwards.
This time?  Not so much.

New Home Sales and RecessionsThis graph shows New Home Sales vs. recessions for the last 47 years. The dashed line is the current sales rate.
Sales of new single-family houses in September 2010 were at a seasonally adjusted annual rate of 307,000, according to estimates released jointly today by the U.S. Census Bureau and the Department of Housing and Urban Development. This is 6.6 percent (±16.9%)* above the revised August rate of 288,000, but is 21.5 percent (±13.3%) below the September 2009 estimate of 391,000.

Tuesday, October 26, 2010

Trucking

ATA: Truck Tonnage Index increases in September: "Economy barely growing"


From the American Trucking Association: ATA Truck Tonnage Index Rose 1.7 Percent in September
The American Trucking Associations’ advance seasonally adjusted (SA) For-Hire Truck Tonnage Index increased 1.7 percent in September after falling a revised 2.8 percent in August. The latest gain put the SA index at 108.7 (2000=100) in September from 106.9 in August.
...
Compared with September 2009, SA tonnage climbed 5.1 percent, which was well above August’s 2.9 percent year-over-year gain. Year-to-date, tonnage is up 6.1 percent compared with the same period in 2009.

ATA Chief Economist Bob Costello said that truck tonnage over the last few months fits with an economy that is growing very slowly. “While I am glad to report that tonnage grew in September, the fact remains thattruck freight volumes leveled off over the summer and early autumn. This is a reflection of an economy that is barely growing.”
ATA Truck Tonnage IndexClick on map for larger image.

This graph from the ATA shows the Truck Tonnage Index since Jan 2006.

The lines are added to show the index has mostly "leveled off".

Monday, October 25, 2010